Wouldn’t it be nice to be able to know with certainty the performance footprint impact of an application before deploying it into a Virtual Desktop Infrastructure (VDI)? This way, you could decide whether it is suitable or not based on data rather than gut feel. However, most IT teams do not have this option.
There are several reasons for that. First, in most scenarios, this means yet another test and additional testing tools, which takes a long time and requires budget. Secondly, dedicated VDI performance testing teams don’t perform these tests on the business apps because they don’t have the specific knowledge of the products that they’re testing.
Today, I am going to show you a new and exciting way of how you can collect the performance metrics in the background while the real users are testing their business apps. This way, you gain a realistic understanding of the impact your application will have on your VDI environment.

Why Application Suitability Testing Is Crucial In VDI Environments
By definition, the term Virtual Desktop Infrastructure, or VDI, refers to a virtualization technology that hosts a desktop OS on a centralized server in a datacenter.
To cut hardware costs, centralize application management, and enable virtual desktops for remote employees, enterprises and other large organizations are increasingly turning to VDI. Instead of equipping every single employee and contractor with his or her own fat-client machine that requires large disk space, CPU power, memory capacity and locally installed applications that have to be maintained by IT, VDI allows many end users to leverage pooled resources.
However, calculating how many users can utilize one server is kind of like overbooking a plane and hoping some passengers don’t show up — but in the case of VDI, they aren’t just put on the next flight. Instead, they would have to share a seat. This means, you hope that users use resource-heavy applications at different times or the whole infrastructure will slow down significantly.
To minimize this risk, it is crucial to test the suitability of an application before you move it into a VDI environment to find out how much memory, CPU, or Input/Output it uses, when, and for how long. But until now, IT teams either had to run each app through extensive (and therefore costly and lengthy) testing or deploy it and cross their fingers that nothing went wrong as they have no way of obtaining this information.
VDI Performance Footprint Metrics Without Additional Workload
Here at Access IT Automation, we have seen our customers struggle with this problem over and over again. So we created a new feature within Access Capture, our App Packaging and Testing Automation platform, that will record the CPU Usage, Memory Usage, IO Usage, number of handlers created by the application in total and every executable file within the package.
This information is collected in the background as a product owner or other tester runs the application through a regular UAT test, e.g., in preparation for your Windows 10 migration or version update. The nice thing is that you are testing the app in real-life conditions and since you are doing this anyway, there is no additional workload involved. However, you now have time-stamped usage data visualized on a neat graph:
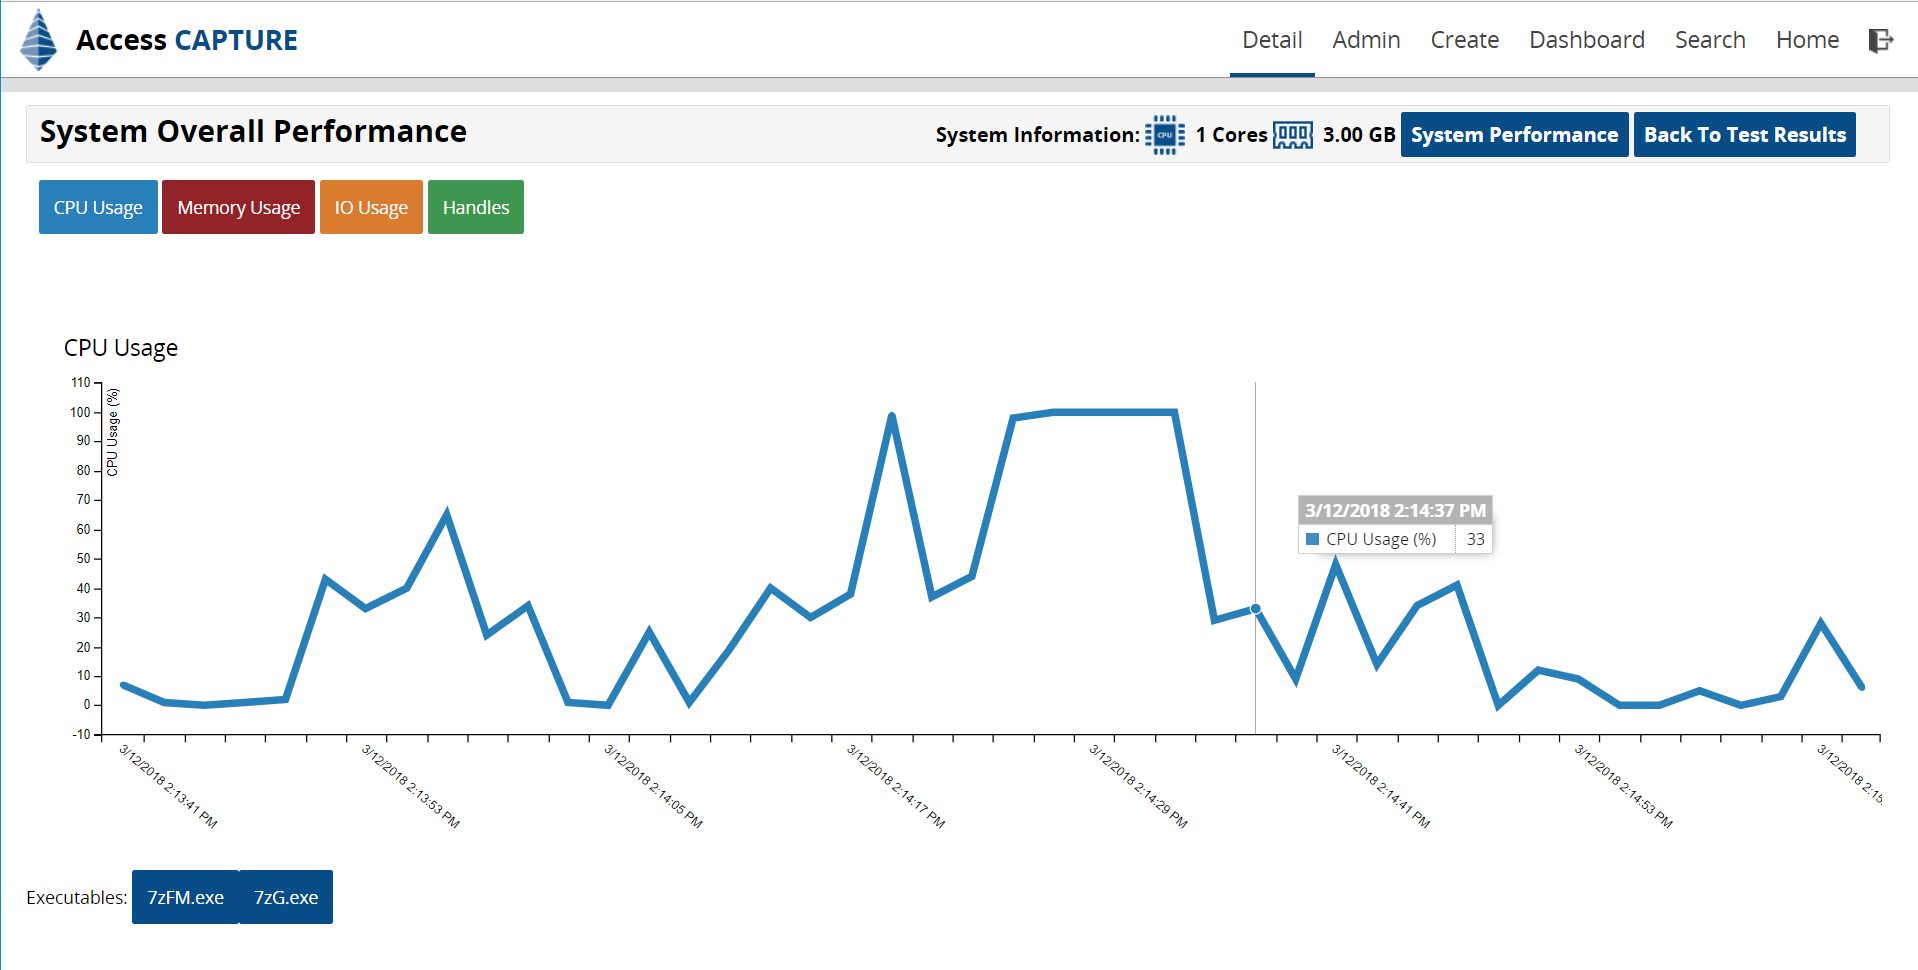
System Overall Performance – CPU Usage

This first dashboard shows you the overall CPU usage of an application during the test. As you can see, the test was started at 2:13 pm and ended at 2:18 pm. This application contained two executables that were launched during the test. The CPU usage is defined as a percentage. If you hover over the graph, you can see the CPU usage percentage (e.g., 33% at 2:14 pm).
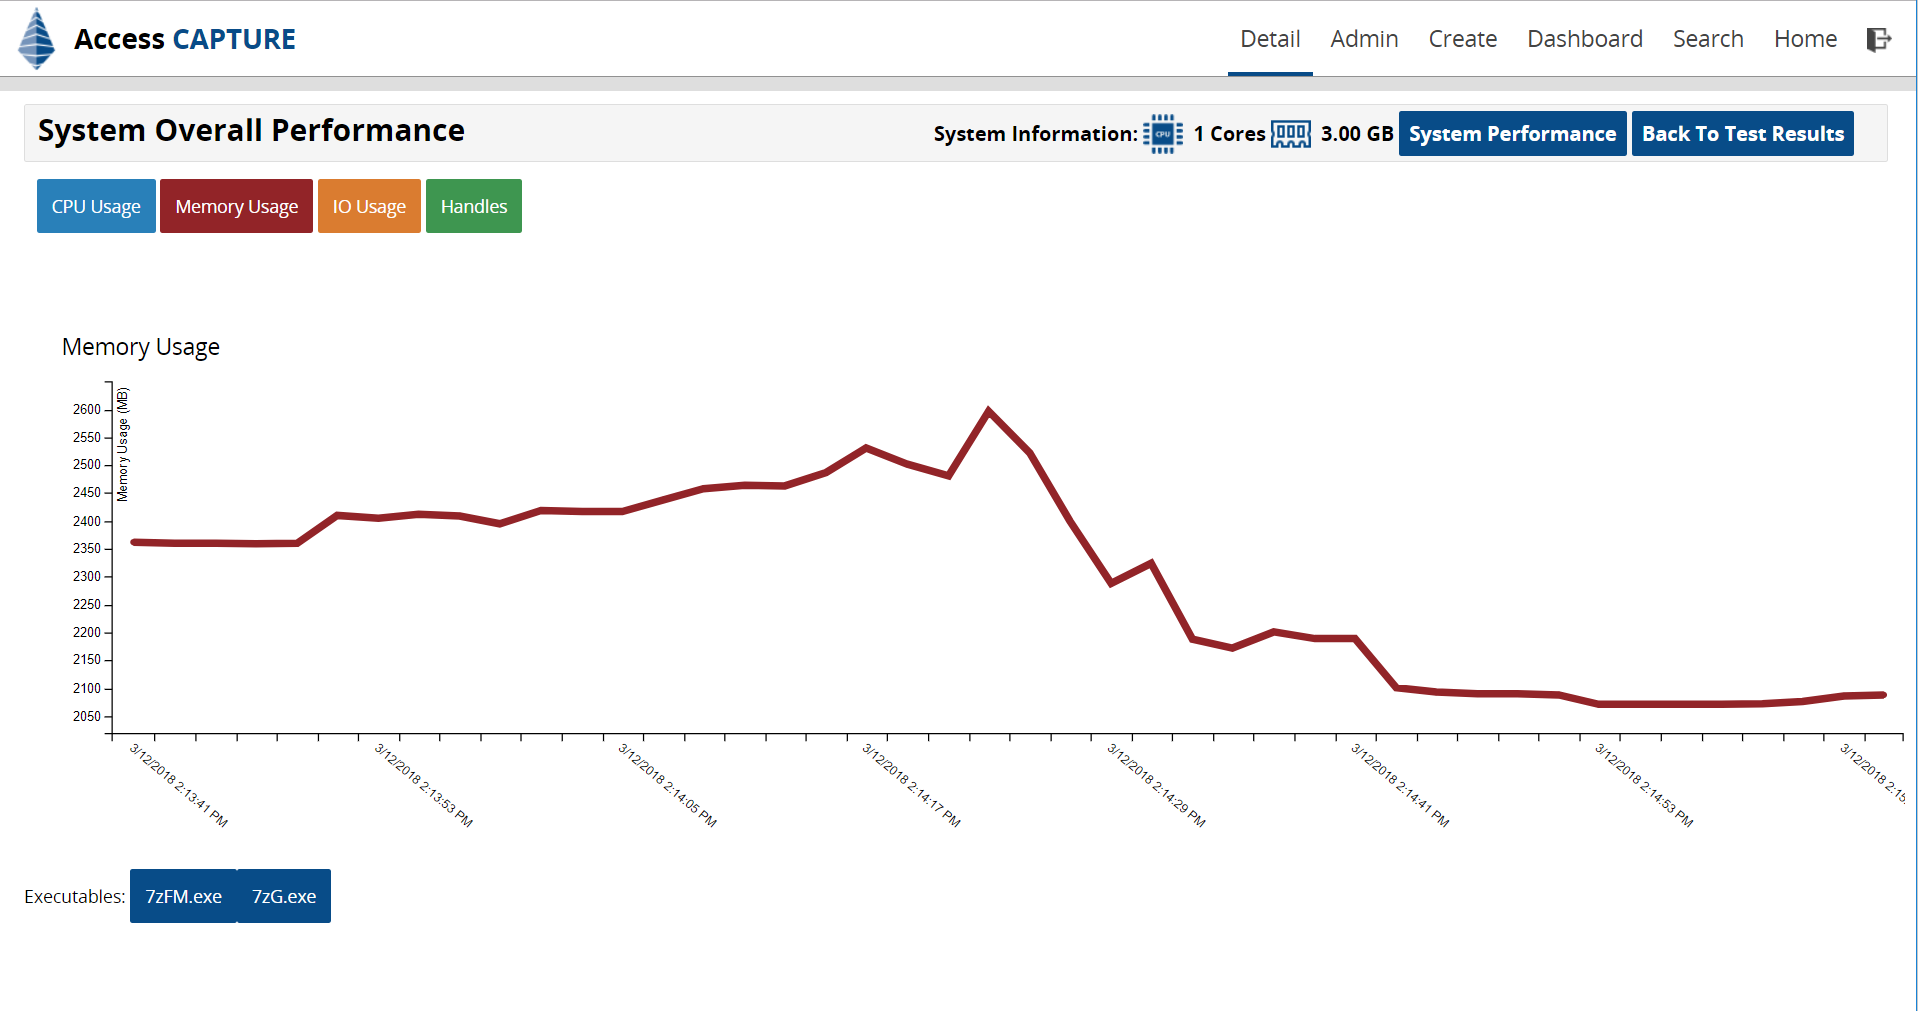
System Overall Performance – Memory Usage

If you click on “Memory Usage” (red button on the top), you get a chart like the one above. You can toggle to IO Usage and Handlers the same way.
As you can see, the memory usage (defined in megabytes) spikes for a short time about half-way through the test and then rapidly declines. Of course, a short spike is preferable to a longer period of high usage as it reduces the chances of other users sucking up the server’s memory at the same time and slowing it down.
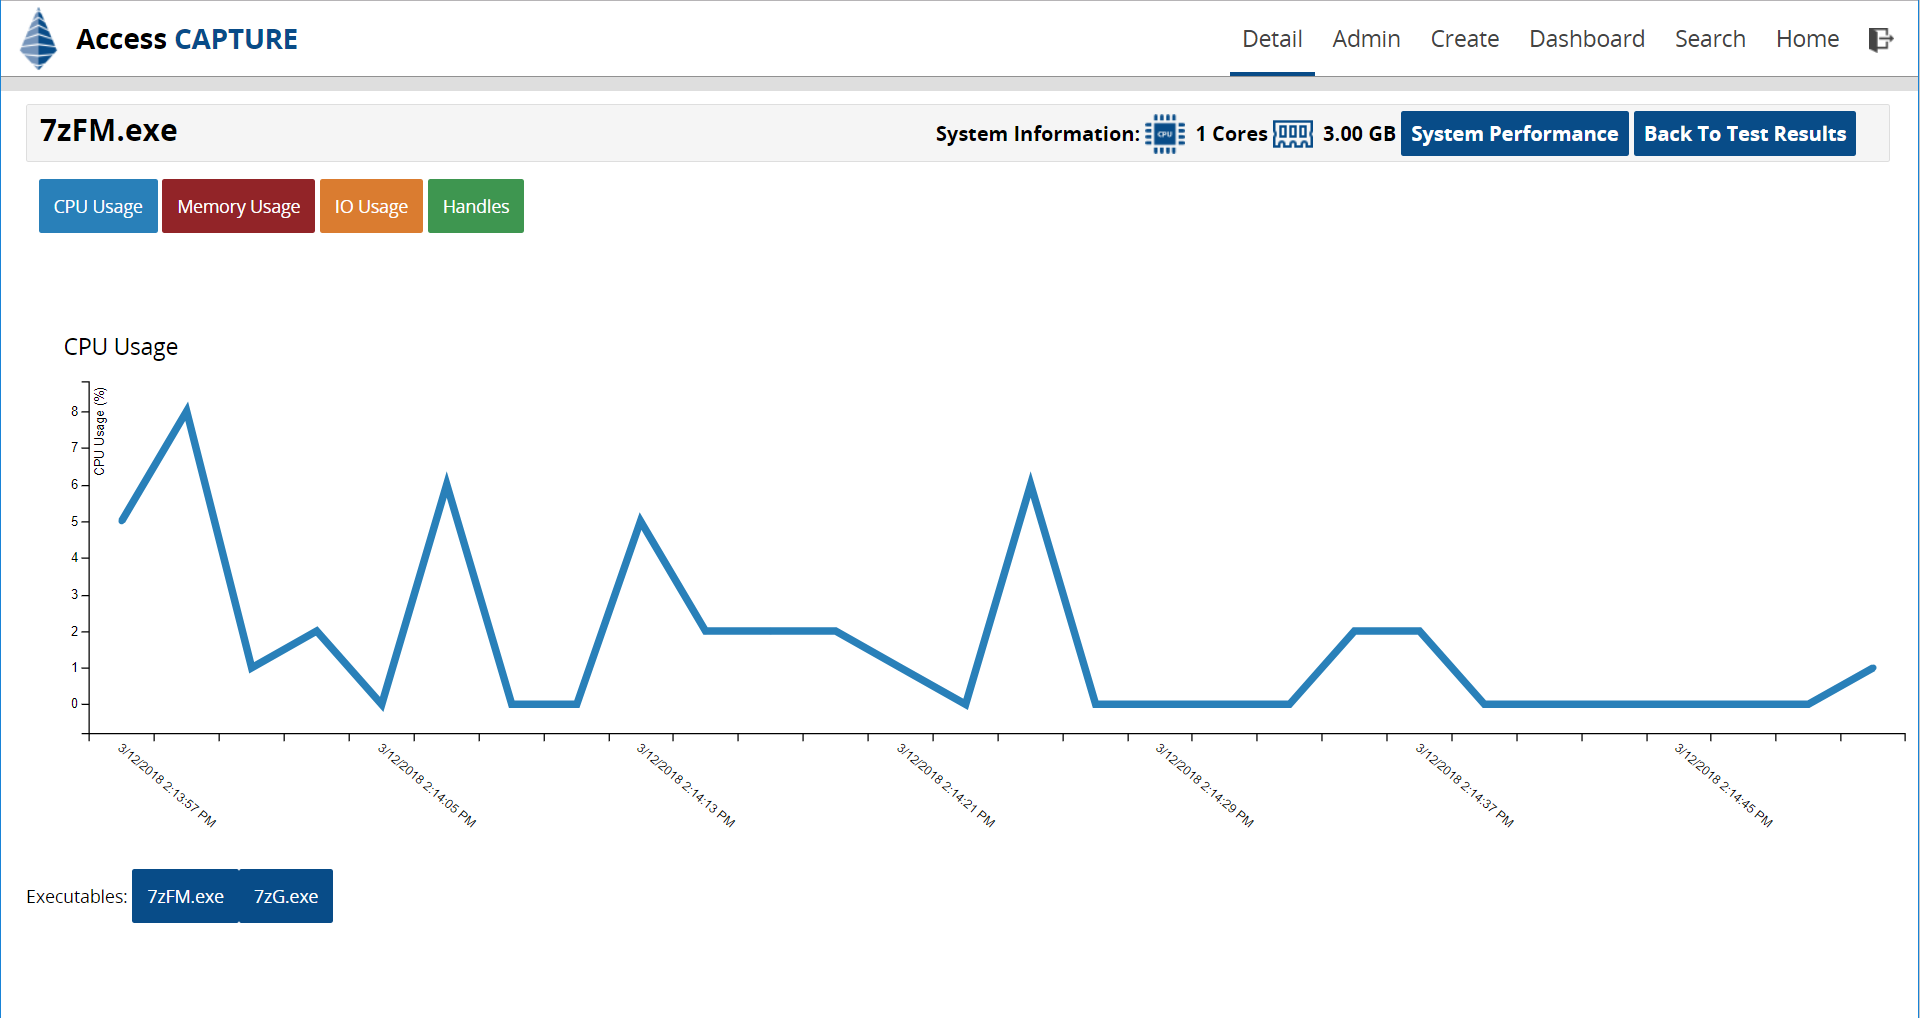
Executable Performance – CPU Usage

After looking at the overall performance impact of your application, you can drill down into every executable that was part of the application testing. If that starts up, we start monitoring it and gathering information about the app itself. You can see, the maximum CPU is 8% at its max.
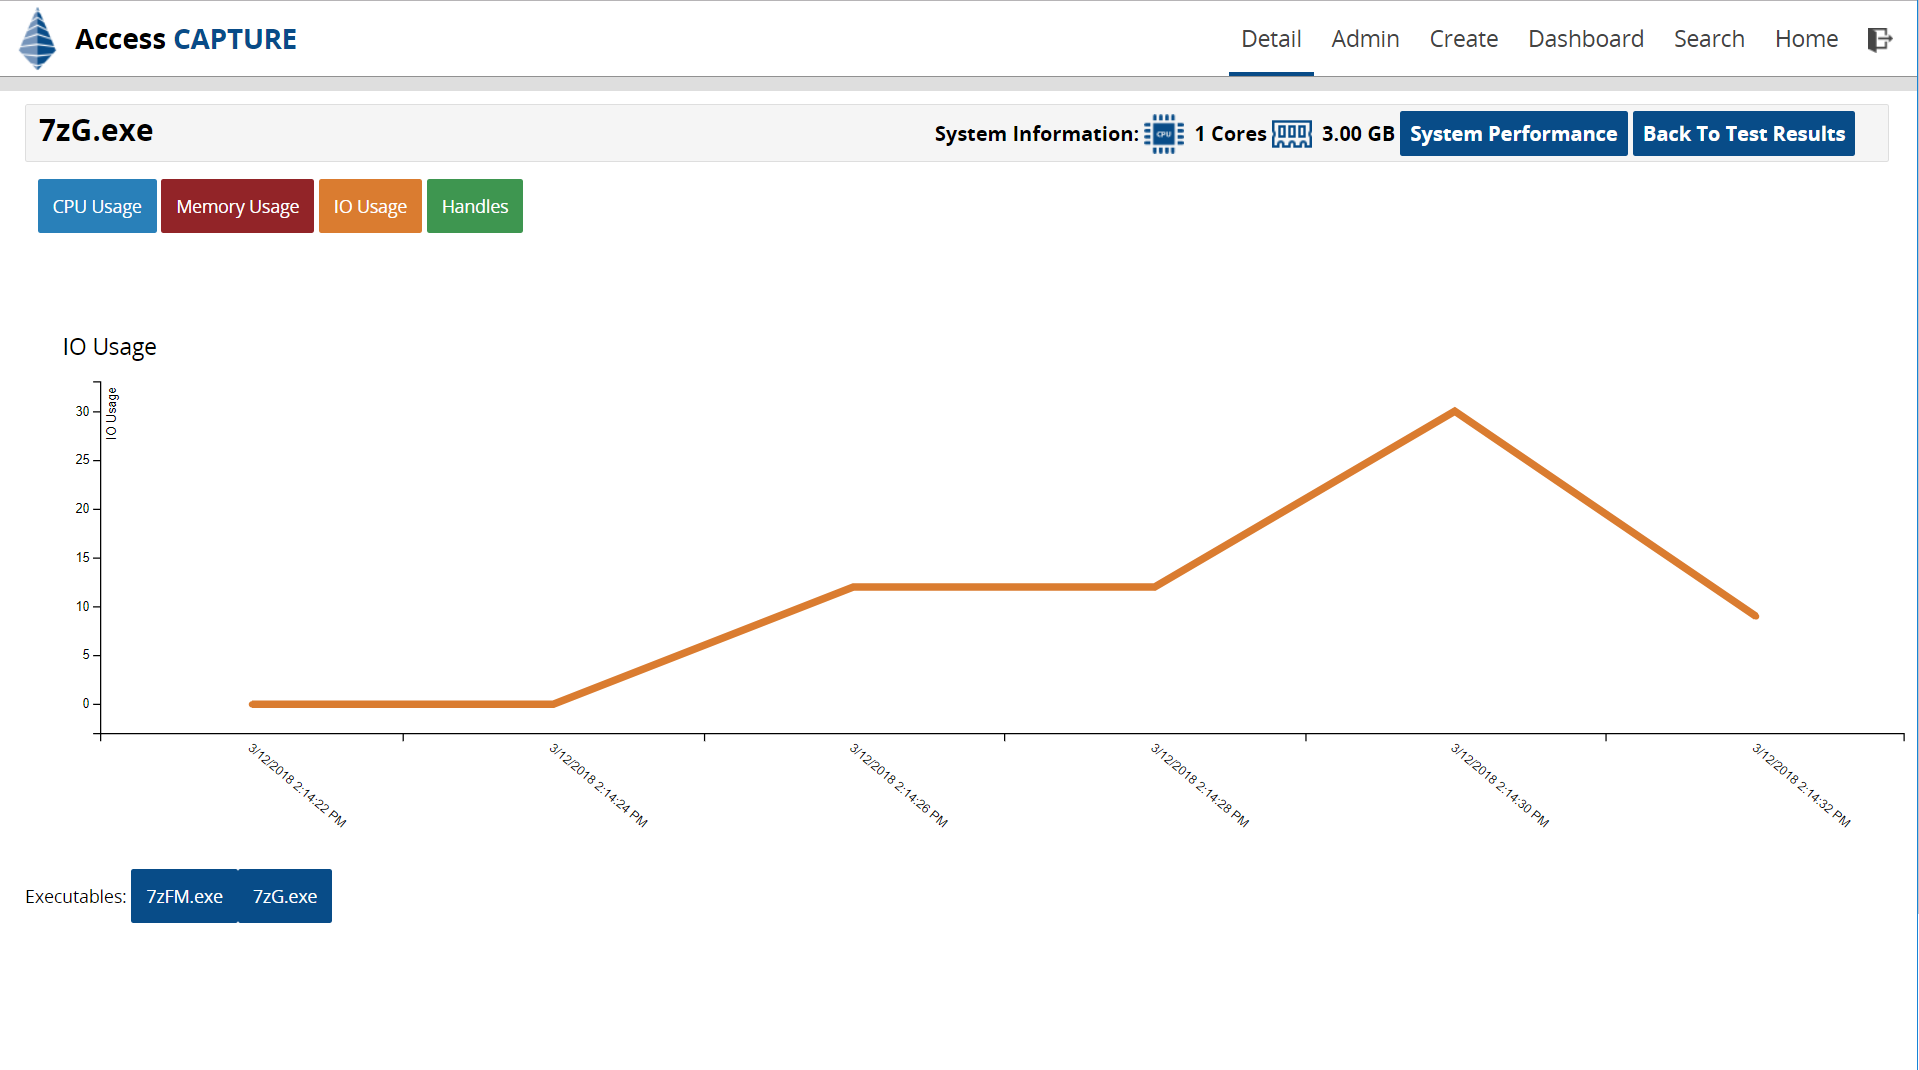
Executable Performance – IO Usage

Another example is the IO usage of this executable above.
How VDI Performance Metrics Will Benefit You
Because most dedicated performance testing teams or organizations with a decent-sized VDI initiative will approach VDI suitability by exclusion of unsuitable applications rather than an inclusion of suitable apps, reliable and accessible performance footprint data is critical. With Access Capture, this crucial data is surfaced and readily available as soon as the application has undergone its regular testing. But because it is done in the background and under real-world conditions, it doesn’t add any extra workload or cost.
Another benefit is that it gives your team a great starting point for investigations should something not behave as expected. Let’s say, the previous four times you tested an app, it was fine but now the CPU usage skyrocketed. Because you have historical data, you can now dig deeper and see what has changed in this new version.
While right now this process is rather manual (someone has to go in and look at the charts), we are planning for the next feature release to add threshold definitions. Once a predefined threshold is reached by an application and it is not suitable for VDI, a workflow is triggered to alert the responsible tester to let him know that this app needs further investigation and placement into the performance testing team’s queue. In addition, we will be adding more counters based on customer feedback.
