As technology changes at an ever increasing rate, being able to quickly, efficiently, and cost-effectively test your applications is fundamental to keeping up with the pace. Depending on your testing strategy, this could include all of your apps or just specific core applications.
Since full-blown manual application testing of all applications several times a year is too expensive, takes too long, and requires an extensive amount of resources, automated smoke testing is often used to quickly test a large number of apps. To help you with this, we are excited to share with you today two new features of Access Capture that we have just released: smoke testing and automated performance testing.
[To stay up-to-date, subscribe to our Access Capture Release Notes here.]
Automated Launch Testing
Also known years ago as “Smoke Testing” or “Build Verification Testing”, Automated Launch Testing is used today to automatically determine if your application is able to perform the most basic and most important functions in a new environment, e.g., launch, perform a function, close out and shut down.
To perform smoke testing in Access Capture, you select the application package you would like to test. For Evergreen purposes, the test environments can be configured in a way that available virtual machines are recognizable by their Windows 10 build version. This way, the app owner can run a smoke or performance test on specific Windows 10 build versions, e.g., 1809 and 1909.
The smoke testing tool is a quick, automated way of checking that the application installs, all shortcuts are launched, and all crucial components work without an error — without you having to prepare, deploy, or break down a virtual machine yourself. In addition, virtual machines are wiped clean after each test, allowing you to run as many concurrent tests as you have virtual machines available in your pool.
Once kicked off, Capture will then fire a virtual machine to test the package on, deploy the apps from the package, and let them run for 30 to 60 seconds (depending on your configuration) before closing them. The testing process is automated and creates video evidence of the process to look for errors, conflicts, and other issues that can be viewed later if a problem occurs.
{% video_player “embed_player” overrideable=False, type=’scriptV4′, hide_playlist=True, viral_sharing=False, embed_button=False, autoplay=False, hidden_controls=False, loop=False, muted=False, full_width=False, width=’1680′, height=’1050′, player_id=’29424254320′, style=” %}
Lastly, Capture’s smoke testing seamlessly integrates into commonly used workflows, i.e., ServiceNow, via API. This means you can extend and build on your existing infrastructure investments.
Automated Performance Testing
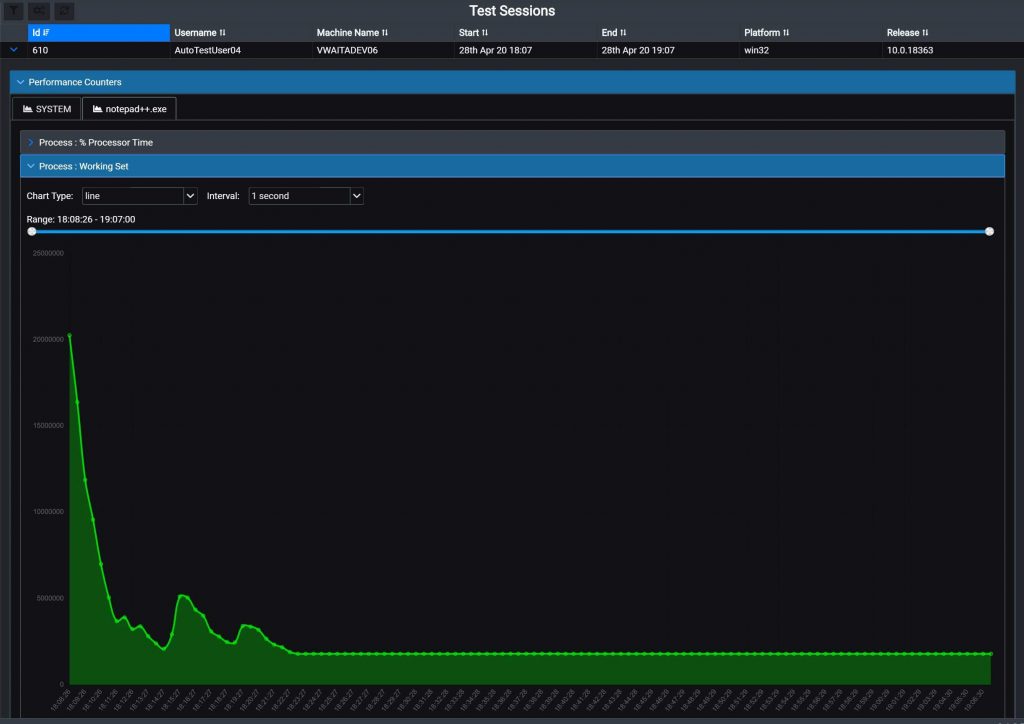
The second new feature I want to introduce you to today is our new Automated Performance Testing. It measures and monitors a wide range of metrics you define for a given application for both the system and the process, e.g., memory usage and CPU usage, process usage, and more.
Essentially, you can measure and monitor every KPI defined in the Microsoft Performance Monitor. The difference between the MS Performance Monitoring Tool and Access Capture’s Automated Performance Testing Solution is that traditionally, IT would run Performance Monitor manually and only on high-value or important apps, and the results come out on that screen only.
This is a labor-intensive process. With Access Capture, these tests are automated and therefore significantly less resource- and cost-intensive and can be done very quickly. Also, all of Capture’s output is fed into a centralized database which allows you to create thresholds or triggers. For example, if an app goes over 200 MB of memory, you want to know about it.
You can test the same application on multiple platforms — and for your desired length of time. For instance, you have the test run for a day or two to see if memory usage spikes, which could indicate a memory leak.
One great use for this testing is when you are upgrading versions of software. Imagine, for instance, 7-Zip. If you are on version 16 and upgrading to version 17, you can measure the resources version 17 takes to get a baseline. When version 18 comes out, you run the performance testing job again to see how the resource requirements have changed.
This is also useful for determining if you need to do a hardware refresh. If you have heavy resource programs like AutoCAD, you can test how many resources it takes up, and then determine how powerful of a device those users would need.
We hope you find this useful. If you have any feedback or comments, we would love to hear from you. If you would like to see these tools in action, schedule a demo below.