



Most IT reporting tells you what happened. Symphony Insights asks the harder question: What exactly should you do next?
Symphony Insights cuts through passive dashboards and turns endpoint data into something far more useful: a live, drillable intelligence layer across people, applications, and endpoints. It does not ask endpoints to change. It does not interfere. It simply takes what the agent has already collected and makes the truth impossible to ignore.
How It Works
- Click any number, row, or count and the whole report reopens around that exact answer.
- Follow the breadcrumb trail back through every question you asked, every filter you applied, and every conclusion you reached.
- Slice by person, machine, application, period, platform, operating system, domain, or device type.
- Export any table to Excel, or copy the query behind any chart and run it independently.
- Track fleet composition, agent versions, check-in freshness, module inventory, runback execution, and audit history.
- Put the live counters your business actually cares about on the front page.
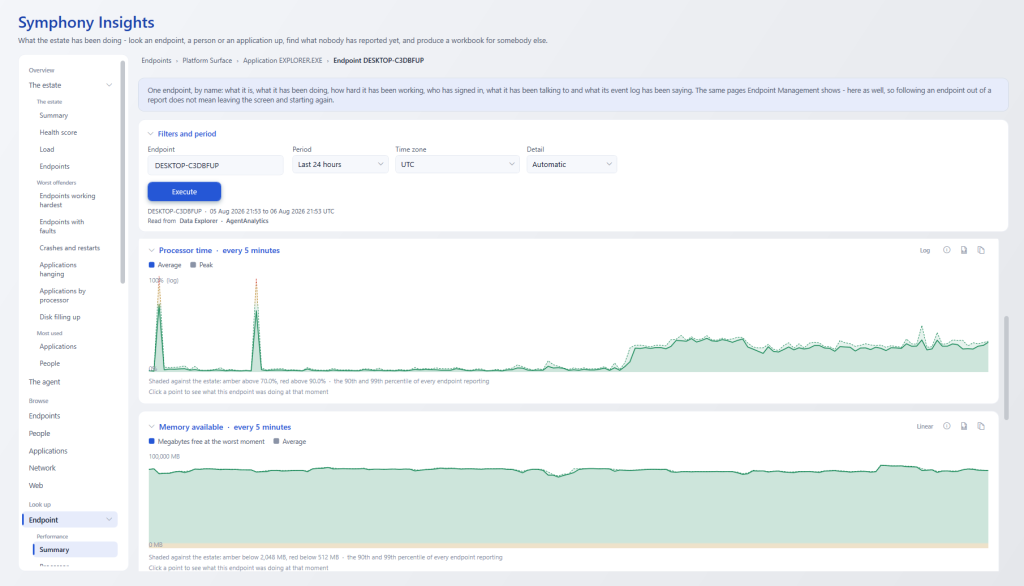
This is the difference between dashboard theatre and operational intelligence.
If a CIO, EUC lead, service owner, or transformation team cannot drill from a headline number to the machines, users, applications, and actions behind it, they are not looking at insight. They are looking at wallpaper.
Symphony Insights is designed for organisations that are done guessing. It gives technical and non-technical teams a shared evidence base for decisions on desktop stability, application usage, hardware asset management, runbook performance, audit trails, and digital employee experience.
The uncomfortable truth? You already have the data. The question is whether your reporting is brave enough to expose it.
Get in touch with us today to find out more.
